 Find Daily Games
Candlestick
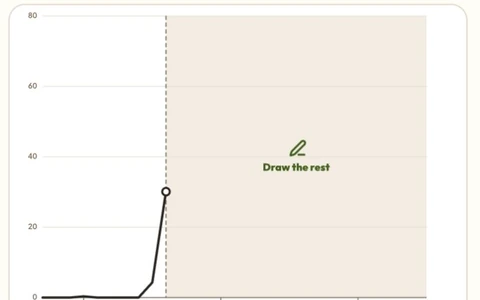
A real price chart of a stock, index, cryptocurrency, currency or commodity is shown with the asset and dates hidden.
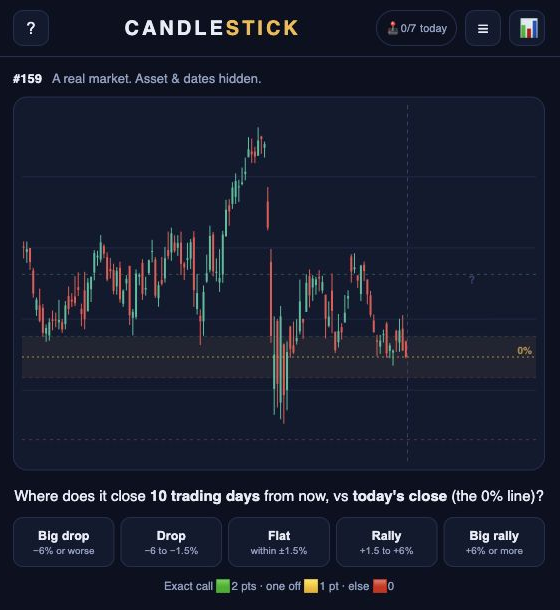
Make 1 call on where it will close 10 trading days later compared with the last close: a big drop of 6% or more, a drop, flat within 1.5%, a rally, or a big rally of 6% or more. The right bucket scores 2 points and one bucket off scores 1, then the chart rolls forward to show what happened and which asset it was.
- Type
- Estimation
- Schedule
- Source-listed daily
- Official website
- candlestick.gg